Detection
Identify and prioritize unhealthy tests across your repositories.
Even with prevention in place, tests can degrade over time. Detection surfaces all unhealthy tests (flaky and broken) across your repositories, so you can see the full picture and prioritize what to fix.
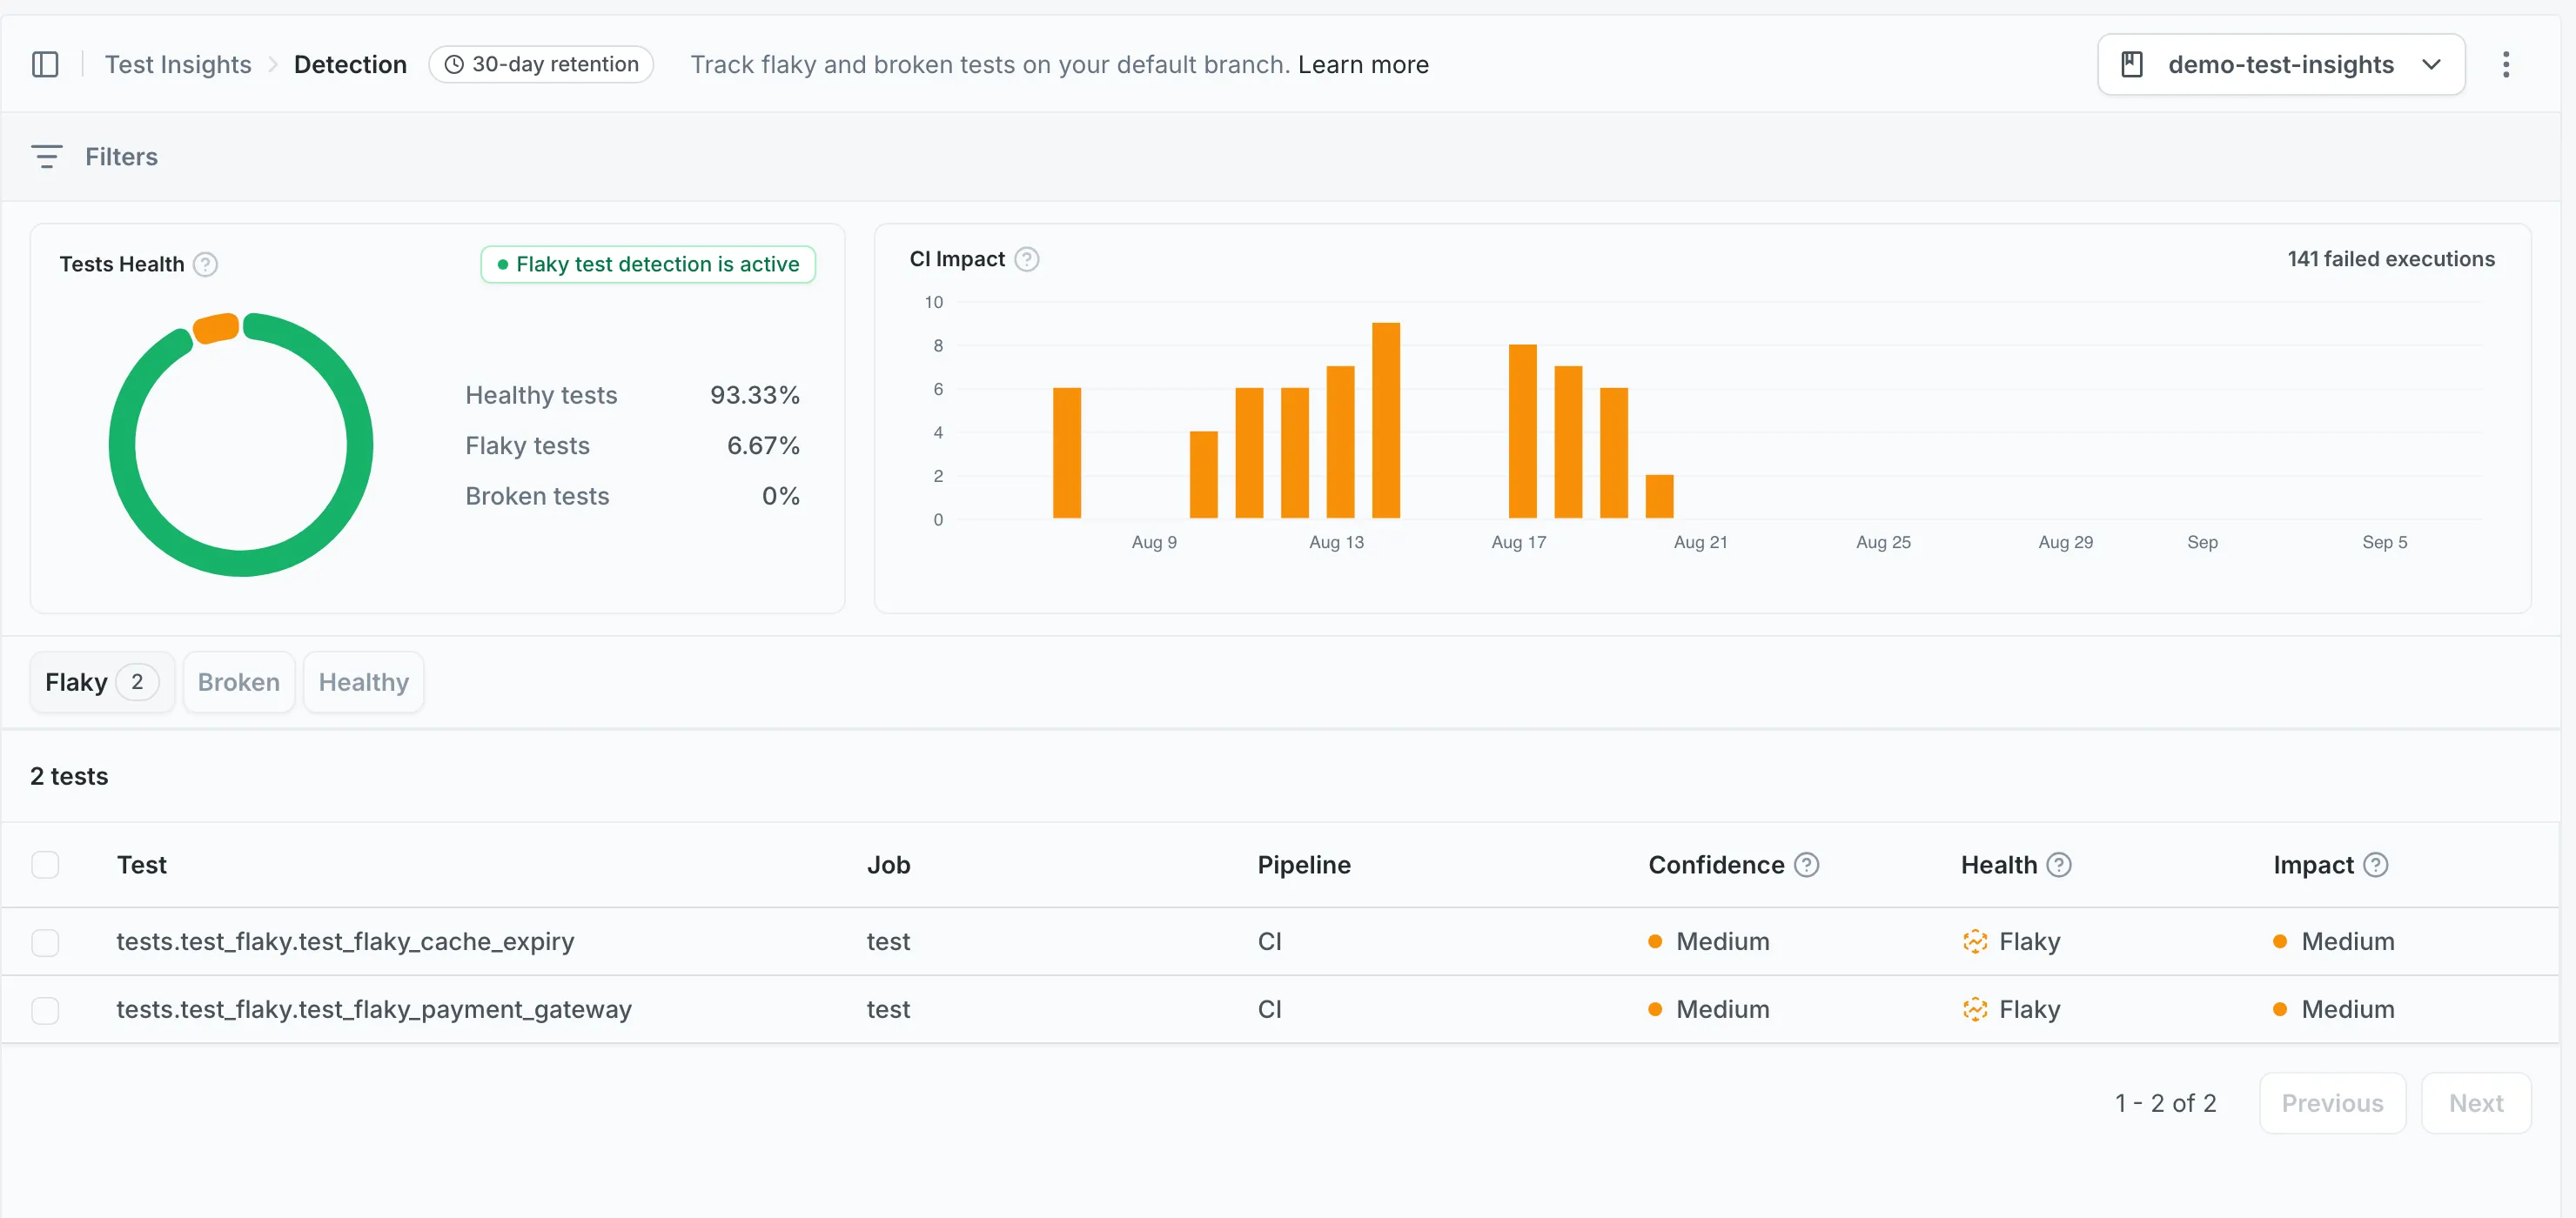
Which runs Detection reports on
Section titled Which runs Detection reports onDetection reports on tests that ran on your repository’s default branch. Results uploaded from pull request branches are stored, but they do not contribute to the metrics shown here.
A repository whose CI has only ever run on pull requests shows an empty Detection page, even though uploads are working. Merge to the default branch and the tests appear after that run completes.
The same scope applies outside the dashboard: the
mergify tests show command and the
test search API return default-branch results.
Prevention covers the pull request side of Test Engine: it reports on tests running on pull request branches.
How tests are classified
Section titled How tests are classifiedMergify classifies a test from the results collected for it across CI runs:
-
Flaky: The test passed and failed close together on the same branch, pipeline, and job, so its outcome does not follow from the code alone.
-
Broken: The test failed and no result close in time contradicts those failures. A test whose runs all fail is always broken.
An isolated failure among a large number of passing runs is not enough to make a test unhealthy. A test that has kept running, and passing, for a week since its last failure goes back to healthy, so a test you fixed stops being reported without waiting for its old failures to age out.
Detection lists tests under a Flaky, Broken, or Healthy tab, so you can work through the unhealthy ones and still look up a healthy test.
Rerunning unhealthy tests
Section titled Rerunning unhealthy testsMergify can rerun unhealthy tests on the default branch automatically, to confirm a test really is flaky instead of waiting for one of its ordinary runs to contradict the last one. Reruns stay within a budget you control, which caps the extra CI time they add.
This is opt-in per repository and requires a test framework plugin. Once a plugin is installed, set a rerun budget on the Detection page in the dashboard to enable it.
Prioritizing with impact
Section titled Prioritizing with impactImpact is the share of a test’s executions that failed, reported as low, medium, or high. A test that fails on most of its runs has a higher impact than one that fails once in a while, whatever the absolute number of failures.
Use impact to decide which tests to fix first: high-impact tests give you the most return on investment when fixed.
Practical workflows
Section titled Practical workflowsFinding your worst tests
Section titled Finding your worst testsFilter on high impact to surface the tests causing the most CI disruption. These are the best candidates for immediate attention.
Narrowing scope
Section titled Narrowing scopeUse filters to focus on specific areas:
- Test name: Search for a specific test or pattern
- Job name: Focus on tests within a particular CI job
- Pipeline name: Narrow to a specific CI pipeline
- Impact: Keep only tests at a given impact level
Checking quarantine status
Section titled Checking quarantine statusTests that have already been quarantined are indicated in the health status. This helps you avoid spending time investigating tests that are already being managed through Mitigation.
Setup
Section titled SetupDetection requires test metrics collection through repeated CI runs. See the CI setup guides for your platform:
Was this page helpful?
Thanks for your feedback!