Monitoring your Merge Queue
Monitor key metrics of your merge queue to improve throughput and reduce latency.
The Mergify dashboard reports how your merge queue has performed over time, and the Mergify CLI reports what it is doing right now.
The Statistics page
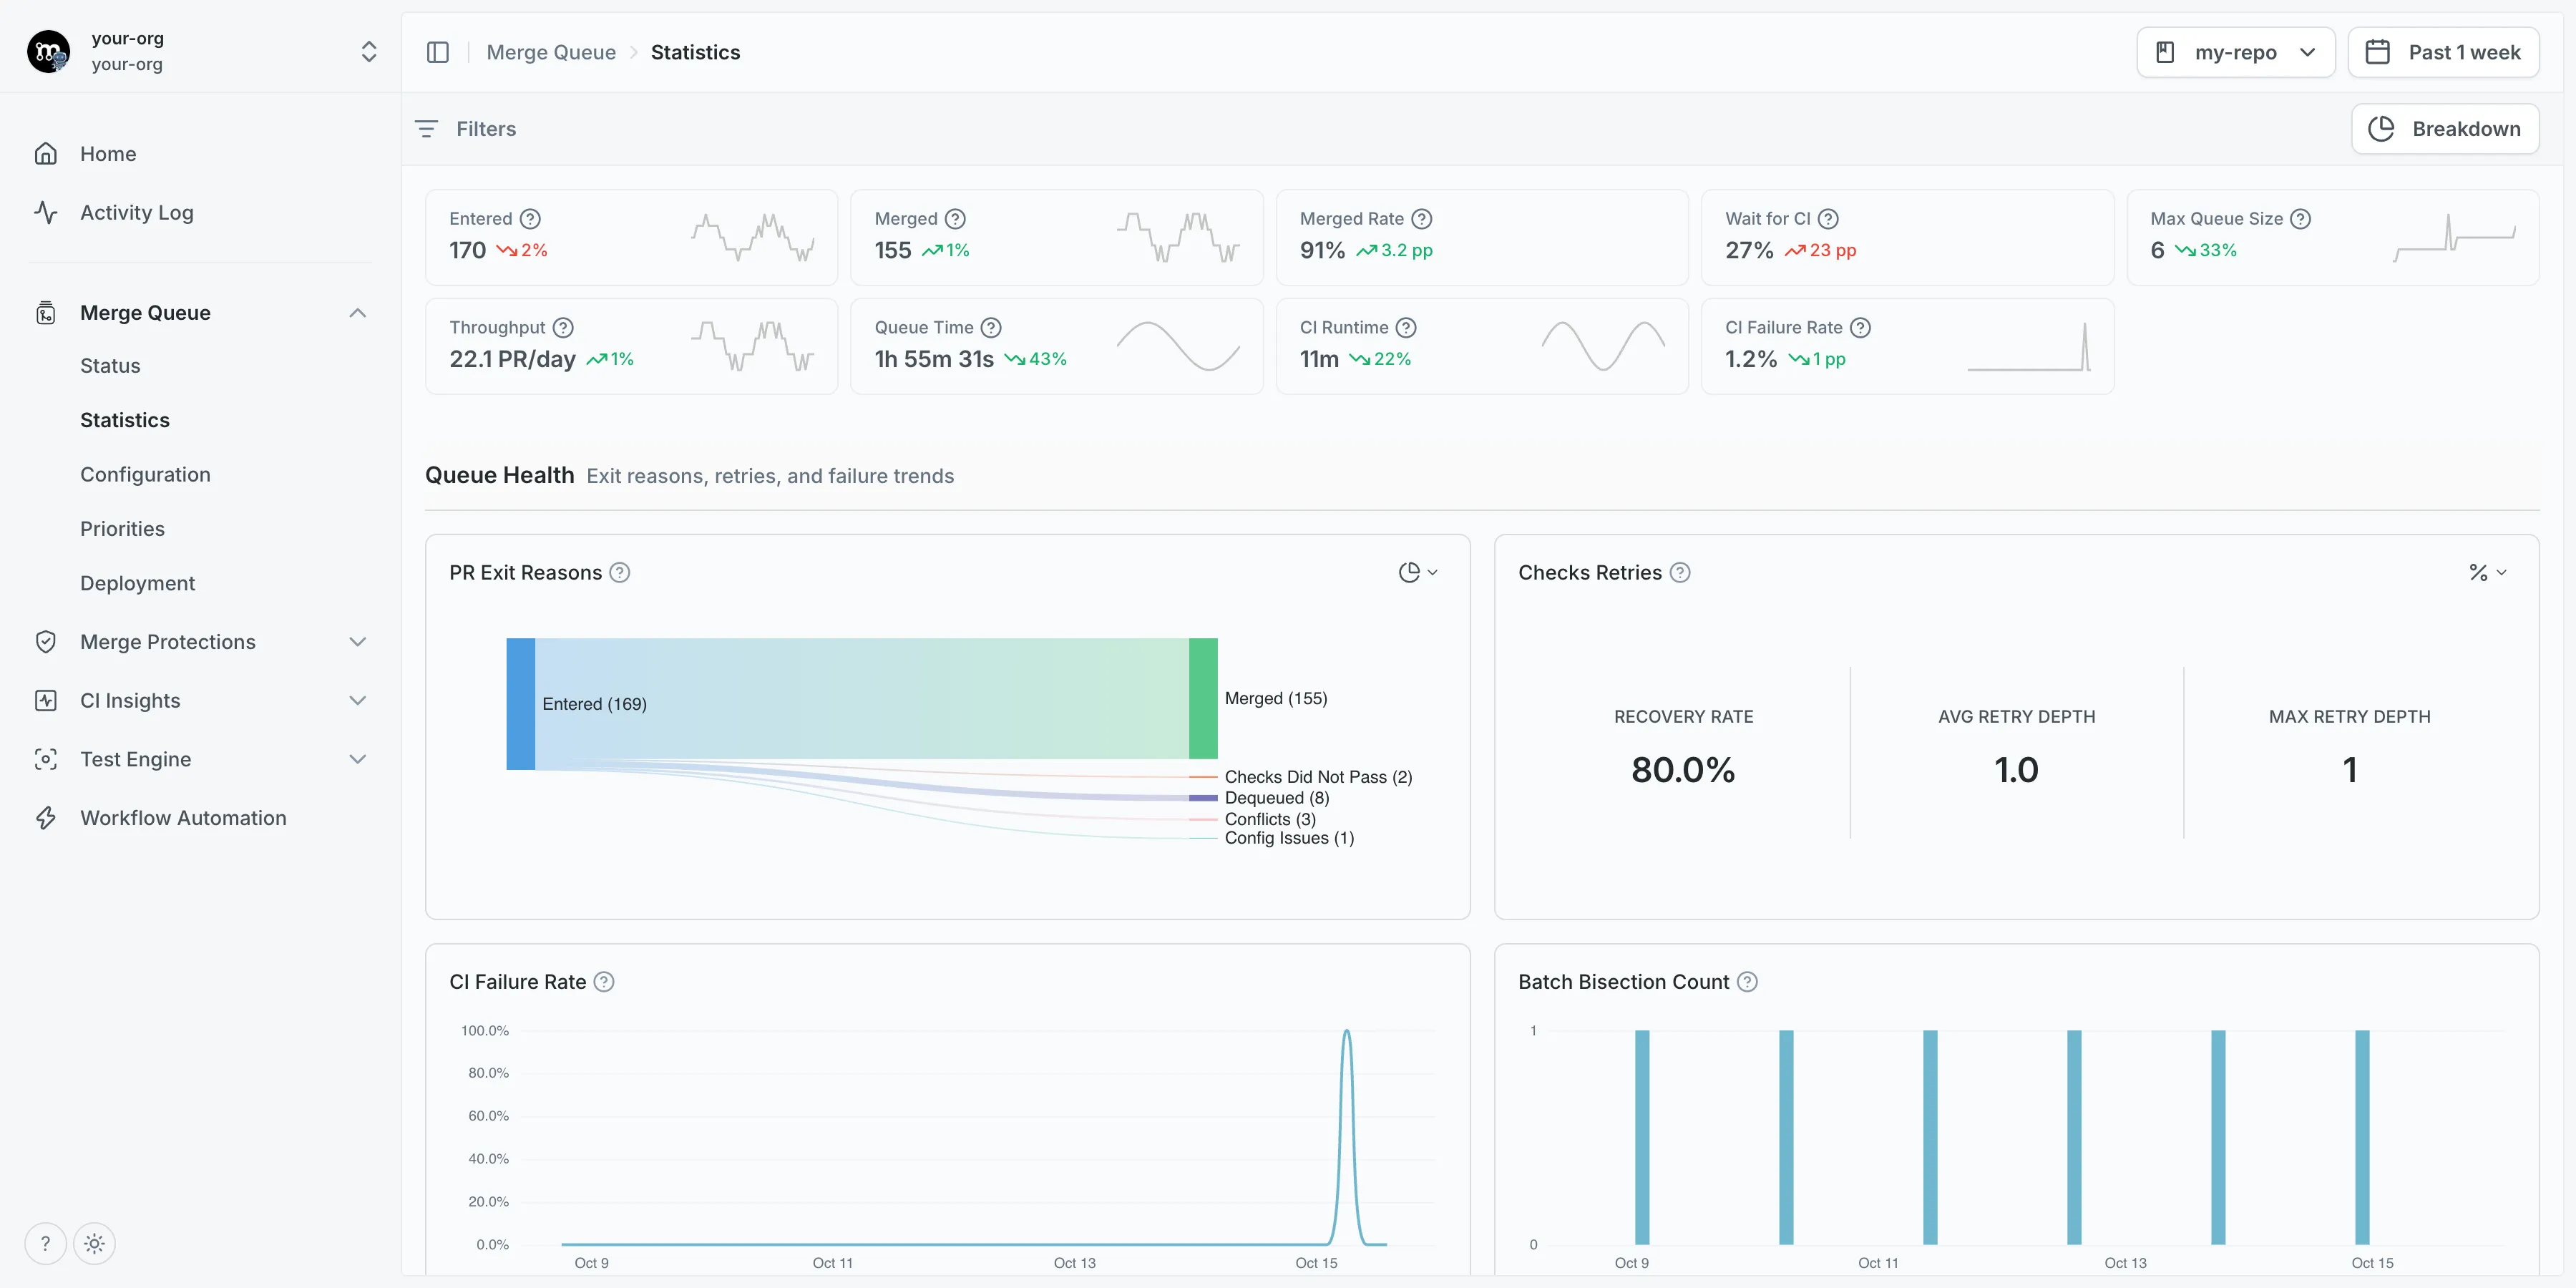
Section titled The Statistics pageOpen Merge Queue → Statistics in your dashboard to see how your queue is behaving:
Use the date picker to select the time range you want to review. Presets go up to “Past 3 months”. Queue data is retained for 90 days: the calendar will not let you pick a day older than that, and the oldest day or two of the longest preset can come back empty.
Three controls apply to every widget on the page at once:
-
The repository selector chooses which repository the page reports on.
-
Filters restrict the data to a set of branches, queue rules, or priority rules.
-
Breakdown keeps all the data but splits each chart into one series per branch, queue rule, or priority rule, so you can compare them side by side. Clicking a series narrows the page down to it. Max Running Checks and CI Runs cannot be broken down by priority rule: a running check covers a batch of pull requests that may come from different priority rules, so it cannot be attributed to a single one. For the same reason, CI Runs is not shown while a priority rule filter is active.
A row of headline figures sits at the top: pull requests entered and merged, the merged rate, the share of queue time spent waiting for CI capacity, max queue size, throughput, queue time, CI runtime, and CI failure rate. Below it, the widgets are grouped into three sections.
Queue health
Section titled Queue healthExit reasons, retries, failure rates, and bisections.
-
PR Exit Reasons: how pull requests leave the queue. The distribution view counts each pull request once by its final exit reason; the over-time view shows how those reasons trend.
-
Checks Retries: how often checks are retried, and how often a retry ends in a merge. A low recovery rate points at genuinely broken tests rather than flaky ones.
-
CI Failure Rate: the share of queue exits caused by a proven CI failure (checks that failed, and checks that ran out of the queue’s checks timeout). Every other exit, a merge included, counts in the total but not as a failure. Exits that prove nothing about your CI are deliberately left out of the numerator: a check interrupted before producing a result, and a pull request dropped untested by bisection. A rising rate usually means flaky tests, unstable CI, or problematic changes being queued.
-
Batch Bisection Count: how often Mergify had to split a failing batch to find the culprit. A high count means batches are failing often.
Throughput
Section titled ThroughputVolume of pull requests processed and queue capacity.
-
Entered PRs and Merged PRs: how many pull requests joined and left the queue over time. Sudden drops or spikes are worth investigating.
-
CI Runs: how many CI runs the queue starts for each pull request it merges, and the share of those runs that were wasted. A run is one check the queue started, on a batch draft pull request or on the pull request itself, and it counts once however many pull requests it carries. Batching lowers the ratio; failed and interrupted checks raise it. A pull request merged without running CI costs no run. The distribution view splits every ended run into succeeded and wasted, with wasted runs broken down by the reason the queue tore them down, failed checks included. The over-time view stacks the same outcomes in each interval. The wasted share counts the runs started in the period, while the charts count a run when it ends: a run still in progress has no outcome yet.
-
Max Queue Size: the largest the queue got. The reference line marks your max checks capacity (max batch size ×
max_parallel_checks), so a queue above the line means pull requests are waiting for a free check slot. -
Average Batch Size: the reference line shows the largest
batch_sizeconfigured across your queue rules. Sitting at the maximum suggests the queue is saturated. -
Max Running Checks: peak concurrent checks. The reference line is your effective
max_parallel_checks(the configured value, or the default when it is unset). If you are often at that line, raisingmax_parallel_checksimproves throughput.
Performance
Section titled PerformanceQueue timing and CI execution speed.
-
Time Breakdown: how a pull request’s time in queue splits across waiting for CI capacity, schedule windows, freeze periods, and CI runtime. Switch each component between Avg, P95, and Max to see whether the queue is usually fast with rare spikes or consistently slow. Only the average is additive, so the total in the center is shown for Avg only. If capacity wait dominates, raise
max_parallel_checks. -
Average Queue Time: the full time a pull request spent in the queue.
-
Average CI Runtime: how long your CI takes. An increase here slows the whole queue down.
-
Merged on a Later Batch’s Pass: batches that
skip_intermediate_resultsmerged on later batches’ passes, without their own checks having to pass. The Summary view has one row per branch, queue rule, or priority rule, showing their share of the batches the queue merged and where each skip happened. During speculative checks, a skip saves the wait for the batch’s own CI run, which has usually started already. It saves CI runs only when that run would have failed, since a failing batch makes the batches tested on top of it run their CI again. During a bisection, the batch’s pull requests merge instead of being dequeued and tested again. A skip with no recorded place, or with both, is listed as unattributed. The Over Time view charts these batches, with their total as Total Batches Saved. On a queue that merges withfast-forwardormerge-batch, a batch merged this way before Mergify started recording such merges on those queues counts as an ordinary merge, so over a range that reaches back that far, the count and the share read low. -
Would Have Merged on a Later Batch’s Pass: replaces the widget above, with the same two views, when
skip_intermediate_resultsis off. It estimates, from the queue’s own history, the batches the option would have merged. Each of them waited for its own CI run instead, and when that run failed, or something else ended it before a merge, the batches tested on top of it ran their CI again. The share is out of every batch the queue would have merged with the option on: those the queue merged, plus any of these batches that did not merge as they were. Mergify records these batches only while the option is off, so a range across a period when it was on reads low, as does one reaching back before Mergify started recording them. In isolated mode, which does not support the option, the widget says so instead of showing figures.
Monitoring the queue with the CLI
Section titled Monitoring the queue with the CLIYou can check your merge queue status from the command line with the Mergify
CLI. The queue CLI reference lists every command and flag.
mergify queue statusThis prints the sections that have something to show, in this order:
-
A pause indicator when the queue is paused, with the reason and how long the pause has lasted.
-
Batches: the batches in the queue as a tree, each with a status icon and the pull requests it carries. When those batches span more than one scope, they get one section per scope, named after it, instead of a single
Batchessection. -
Forming: the batches still collecting pull requests. A forming batch holds no place in the merge order yet, so it sits in its own section, with its pull requests under it rather than in the
Waitingsection. -
Waiting: the pull requests still waiting, each with its author, priority, how long it has been queued, and estimated merge time.
When the queue holds no batches and no waiting pull requests, the command prints
Queue is empty, under the pause indicator if the queue is paused.
Each batch reports a batch status describing what it is doing, such as running its checks or waiting for a schedule.
To filter results to a specific branch:
mergify queue status --branch mainUse --json for machine-readable output:
mergify queue status --jsonInspecting a pull request
Section titled Inspecting a pull requestTo see the detailed state of a specific pull request in the queue:
mergify queue show <pr_number>This displays the PR’s position, priority, queue rule, CI checks summary, and
blocking conditions. See the
mergify queue show reference for its flags.
Integrations
Section titled IntegrationsYou can also build your own monitoring solution using the Mergify API.
Was this page helpful?
Thanks for your feedback!