Self-hosted runners
Monitor the self-hosted CI runners behind your pipelines so you can spot capacity bottlenecks, degraded machines, and wasted spend.
Self-hosted runners are the machines that execute your CI. Mergify doesn’t provision or control them. It watches the jobs they run and turns that data into metrics about capacity, performance, cost, and reliability.
That fleet is infrastructure you own and pay for, but it usually runs as a black box: you only hear about it once builds start queuing or failing. These metrics let you base scaling and reliability decisions on what the fleet actually does.
Why monitor your runners
Section titled Why monitor your runnersThe metrics answer a few recurring questions:
-
Is the fleet the right size? Idle runners mean you pay for capacity you don’t use. Saturated runners mean jobs wait. Both are expensive, in different ways.
-
Is a runner degraded? One slow or flaky machine drags down every job scheduled on it, often without an obvious failure.
-
Where is CI time going? Time spent waiting for a runner and time spent running on it are different problems with different fixes.
-
What is the fleet costing? Cost per runner and per job shows where spend concentrates.
What Mergify tracks
Section titled What Mergify tracksMergify groups these metrics into two areas.
Queue: is work waiting for a runner?
Section titled Queue: is work waiting for a runner?The queue tracks how long jobs wait to get a runner and how many are waiting, grouped by the labels they request. Read the two signals together: rising wait times with steady demand point to a capacity problem, so add runners; a spike in queued jobs points to a demand surge instead. The aim is to keep runners ahead of demand, before queue time starts delaying pull requests.
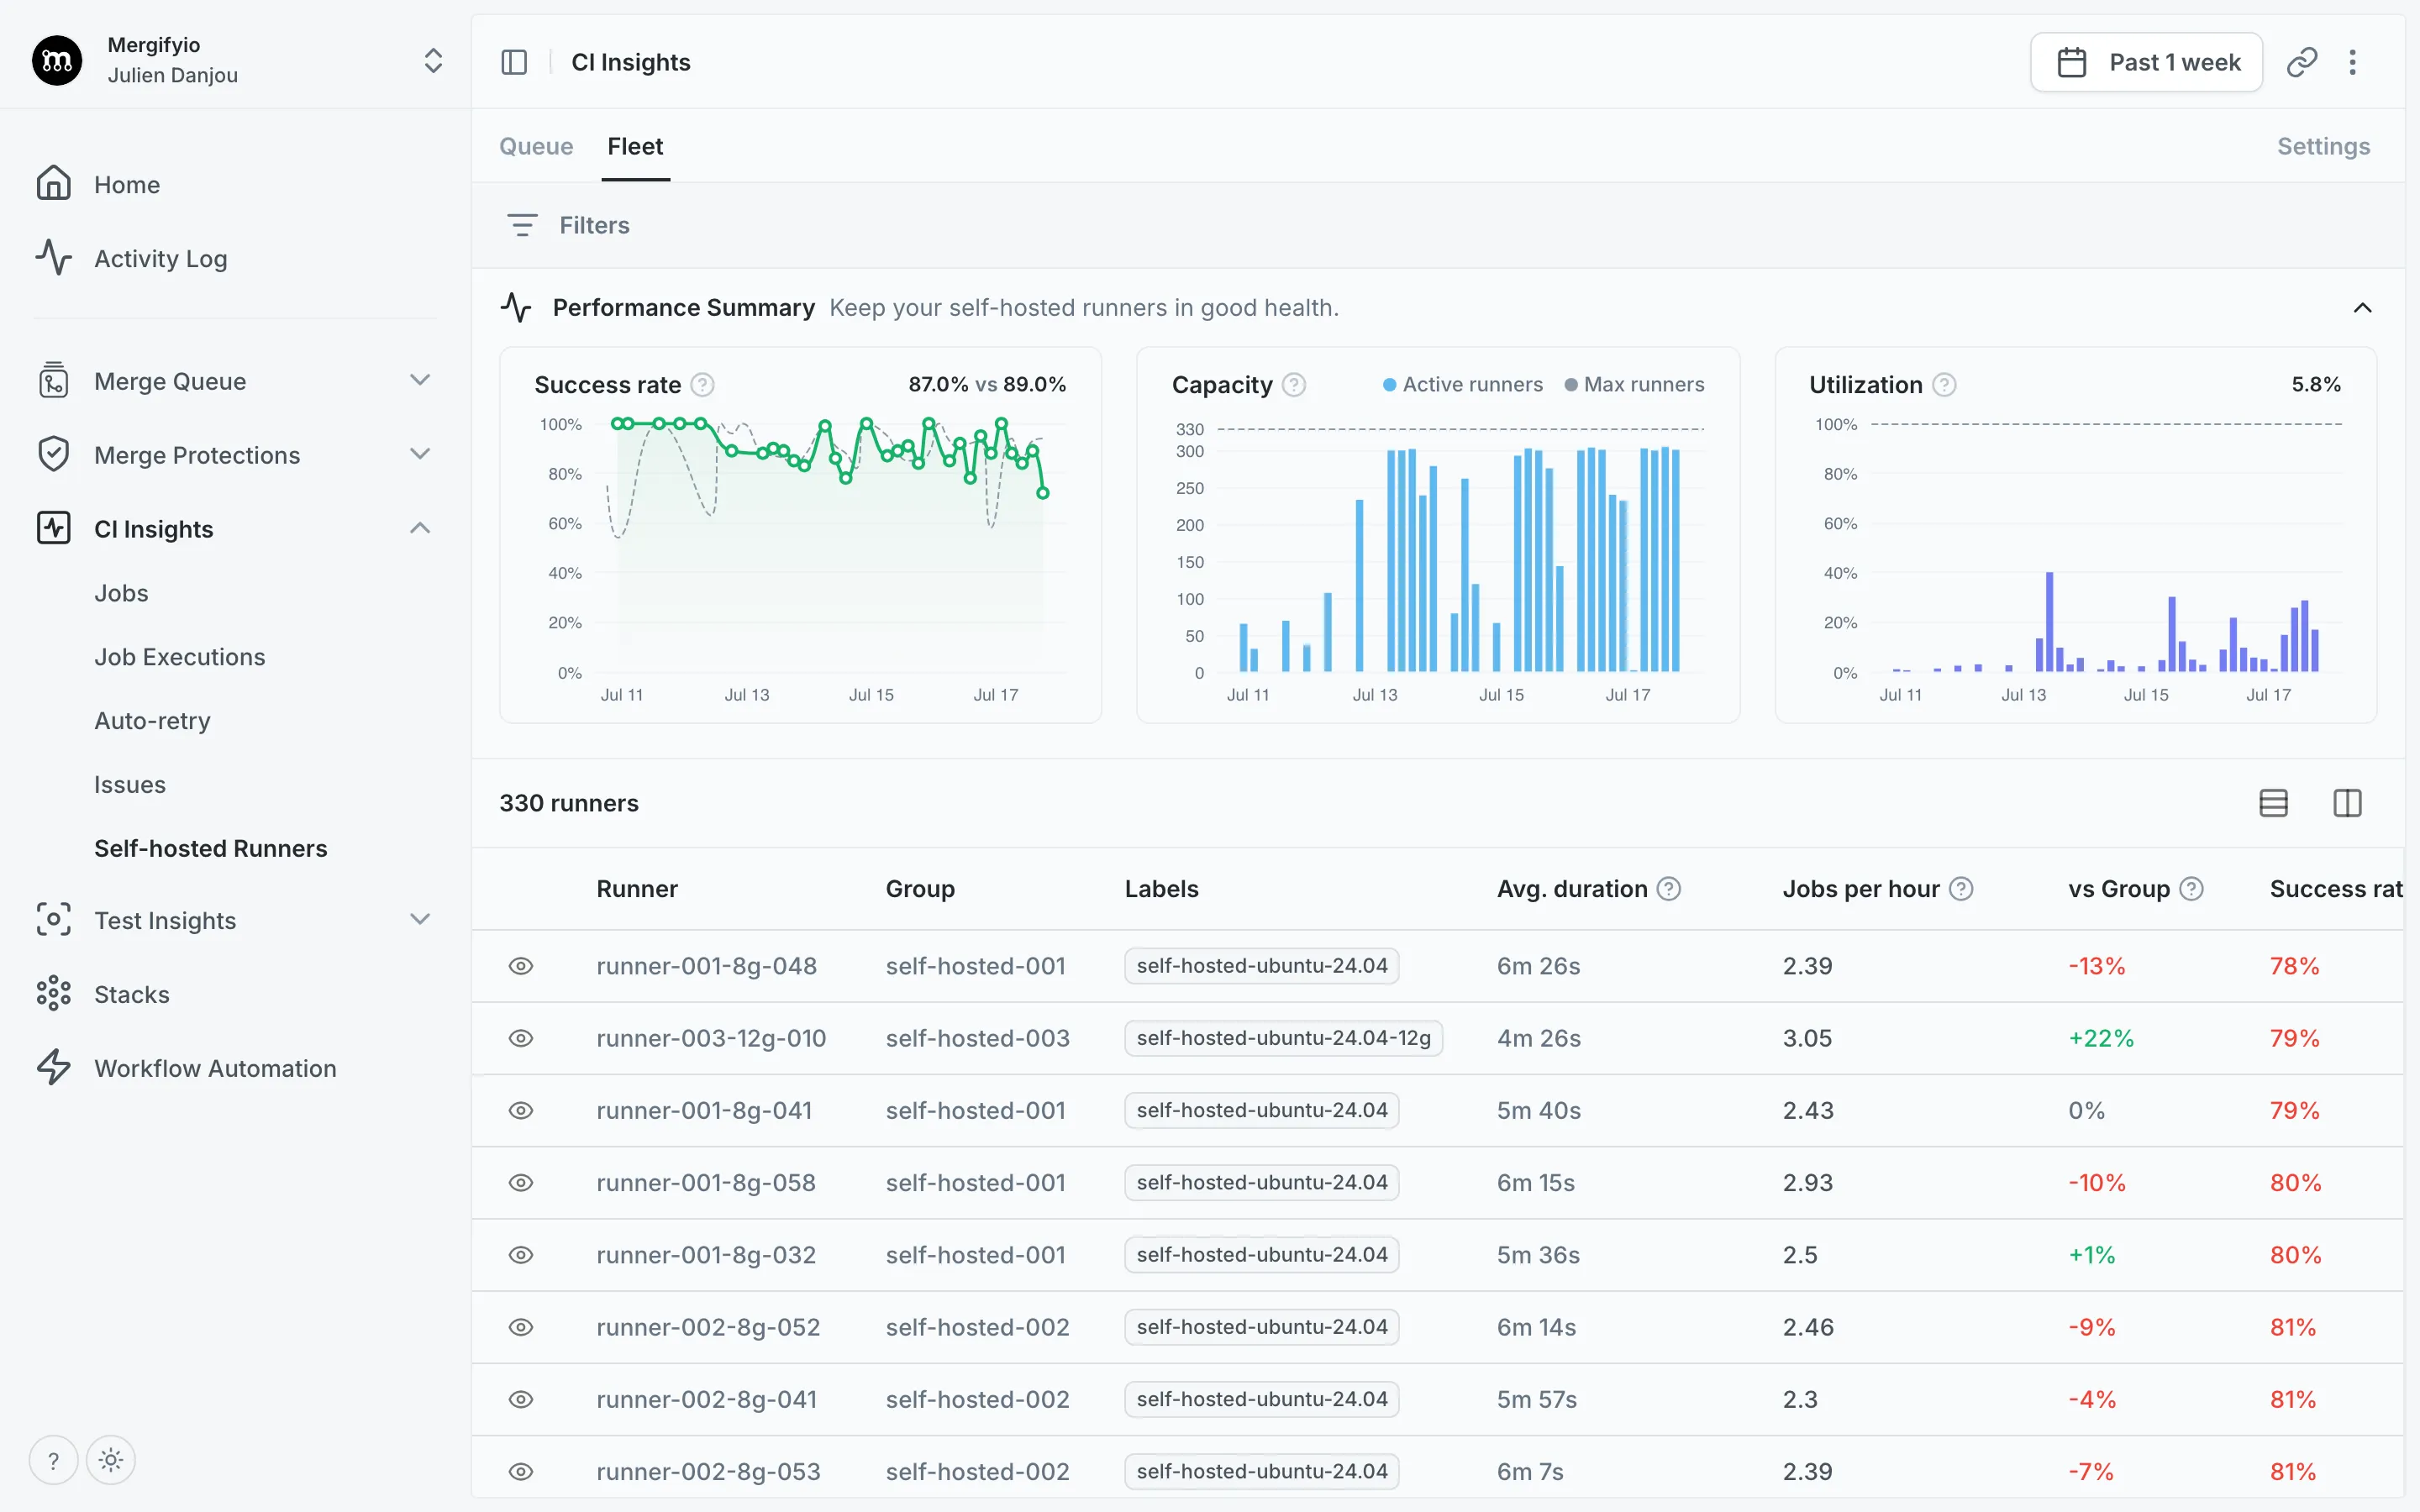
Fleet: how is each runner performing?
Section titled Fleet: how is each runner performing?The fleet is your runners seen one at a time: throughput, speed, success rate, and how each runner compares to its peers. Each runner carries a health status, so an underperforming or unstable one is easy to single out. You can also follow each runner’s trends over time and see how heavily it is being used.
No runner setup required
Section titled No runner setup requiredOnce CI Insights is enabled, Mergify tracks your runners automatically. It works out what to monitor from the jobs it already sees:
-
A runner shows up once it’s reused. Mergify holds off the first time a runner appears: a runner that only ever handles a single job is treated as ephemeral and left out. As soon as a runner picks up a second job, Mergify recognizes it as a persistent machine and starts tracking it. This keeps your dashboards free of the ephemeral runner identities that large fleets churn through.
-
Queues follow the same rule. A queue is the demand from every job that requests the same labels. A job’s wait counts toward its queue only once the runner that picked it up has been reused, so ephemeral runners don’t create one-off queues.
Key concepts
Section titled Key concepts-
Runner groups and labels. Runners are organized into groups, and labels (the
runs-onvalues a job requests) identify which kind of runner handled the work. Mergify uses the group to compare each runner against its peers. -
Persistent runners only. This page tracks runners that get reused, not the ephemeral ones that run a single job. For those, use the Jobs page.
-
Wait time vs. run time. Wait time is how long a job sits before a runner picks it up; run time is how long it executes once started.
-
Health status. Derived from a runner’s success rate and its speed relative to its group, so machines that need attention surface on their own.
Was this page helpful?
Thanks for your feedback!